l> GP3D USER GUIDE
Mobirise Website Builder

Quick Start Guide
&
Full User Manual

Learn to activate and use the online and offline software to create 3D maps and analyze subsurface anomalies with machine learning AI

Common Questions

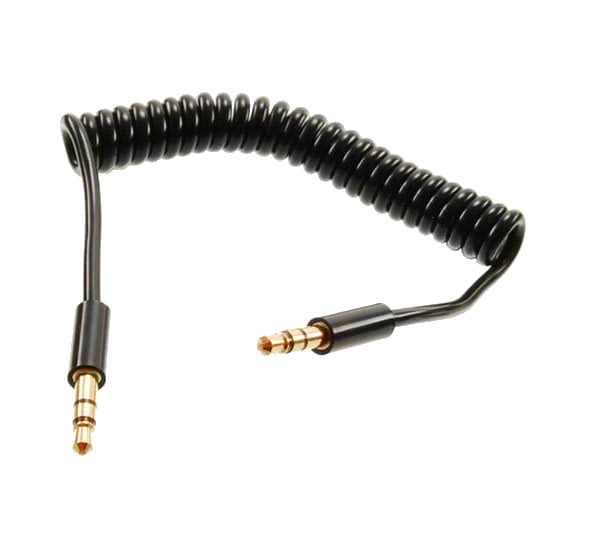
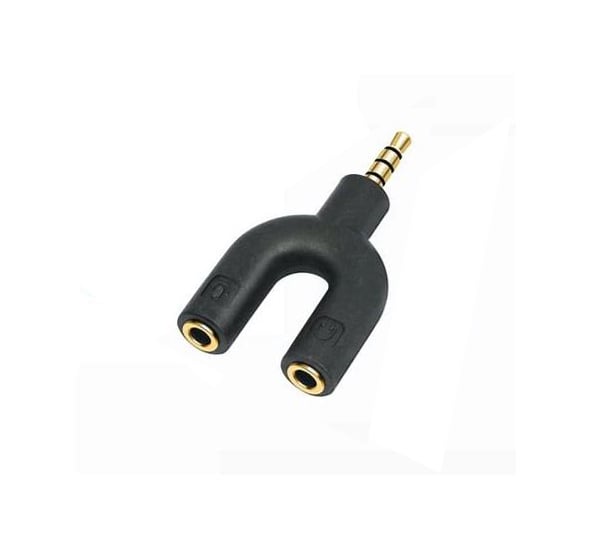
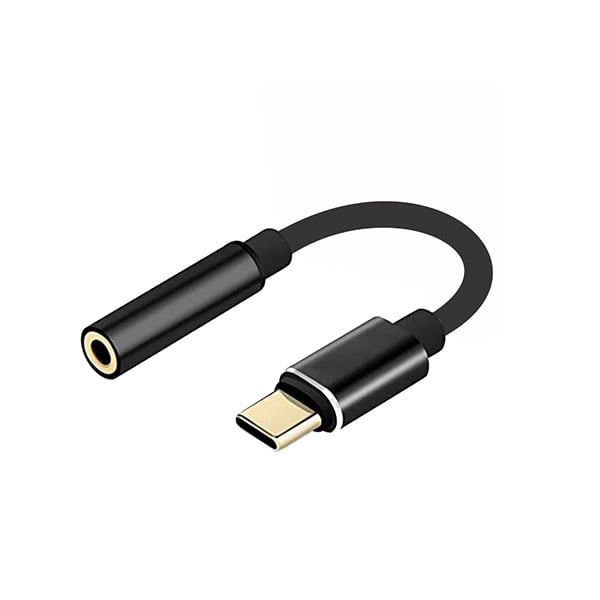
If your phone uses a 3.5mm TRRS input (common older devices) then the "3.5mm x 2 TRS to TRRS Splitter/ Adapter" (listed in our products section) is what you need. If your phone/tablet uses a "Type-C" connection you will need a "Type-C to 3.5mm TRS adapter (most modern tablets/phones etc). You may also require a "3.5mm TRS Cable - 1/8" Male to Male" (listed in our products section) to make connection from the adapter to the detector. 

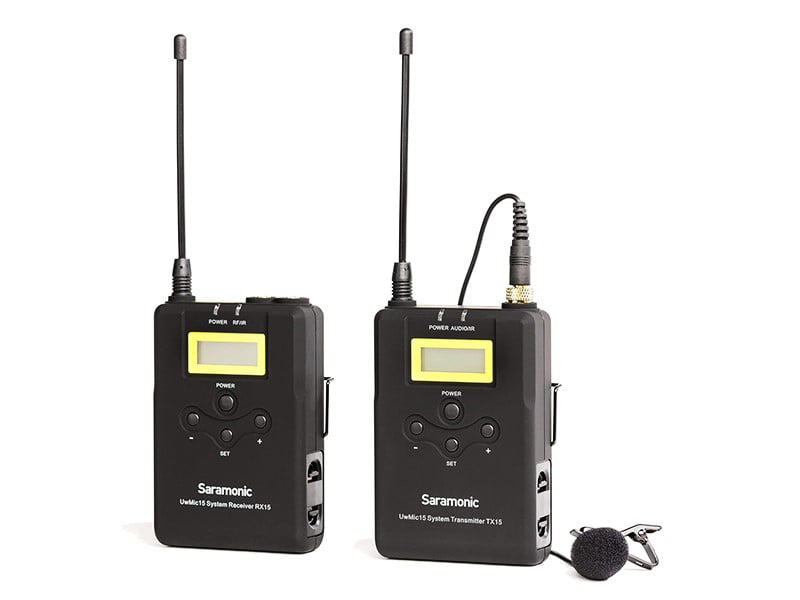
You can use the "UHF Wireless Audio Transmission System" (listed in our products section) with the transmitter mounted to the detector and the receiver connected to the laptop. You may also need a "50 pc Accessory Mount Kit" and or a "3.5mm TRS Cable - 1/8" Male to Male" (listed in our products section).

You can use the phone mount system included in the "50 pc Accessory Mount Kit" (listed in our products section) and mate it to whatever base mount is best suited to the body or tubing of your device. Make sure to mount it as far from the detector sensor array as possible to avoid unwanted interference. You may also need a "3.5mm TRS Cable - 1/8" Male to Male" (listed in our products section).

You can choose from various universal mounting components included in the "50 pc Accessory Mount Kit" (listed in our products section) and mate them to whatever base mount is best suited to the body or tubing of your device. Make sure to mount it as far from the detector sensor array as possible to avoid unwanted interference. You may also need a "3.5mm TRS Cable - 1/8" Male to Male" (listed in our products section). 

You can use clamp mount and 1/4" x 20 (standard) threaded mount included in the "50 pc Accessory Mount Kit" (listed in our products section). The clamp will easily attach to the lid/screen edge of the laptop. Or you can used the threaded fitting with the included mini tripod separate from the laptop. You may also need a "3.5mm TRS Cable - 1/8" Male to Male" (listed in our products section).

πŸ”Geo Pro 3D Quick Start Guide

🟒 Go to Geo Pro 3D’s homepage and click β€œGet the Tech”
🟒 Create login credentials and access the dashboard.
🟒Choose between:
   πŸŒ€ Start Free Account + Trial: 14-day (no commitment) & open "Visualizer Pro" 
   πŸŒ€ Download/ install the offline software: (two-device license, no subscription required).

🟒 Plug in or sync your wireless mic from the metal detector or geo scan device to laptop, phone etc.
   πŸŒ€ Laptop or PC (use the offline software version).
   πŸŒ€ Phones and tablets (use the online version- requires data connection) 
🟒 Select from the Pre-set Detector Database or select/ create a Custom Save Profile
   πŸŒ€ Verify coil dimension, tech type etc. and input specifications if needed (save if settings are altered).
πŸ’‘ For detailed instruction Refer to section: (1a.) through (1d.) in the Geo Pro 3D Full User Manual.

🟒 Push "START" to start the live feed spectrum analyzer.
🟒 Adjust the "FQ SCALE" to desired view.
🟒 Adjust the "GAIN CUT" slider to reduce volume and interference and clean the input signal.
🟒 Click "LOCK" to lock the sliders to prevent accidental touch.
🟒 Input new file name.
🟒 Set the "RATE" (sample pulse rate per second).
🟒 Set the "COUNT" (Total samples intended along the path of travel).
🟒 Set the "TIMER" (countdown in seconds until scan starts).
πŸ’‘For detailed information about setup: Part 2.-Geo Pro 3D Online/ Offline Program Setup
🟒 Start scan via:
    πŸŒ€ Click "LIVE SCAN" mode (listen to countdown tone (one per second) start motion on "0".
    πŸŒ€ Click "POINT SAVE" mode (sample single points on the grid).
🟒 After completion tone:
    πŸŒ€ Move over one sample distance (distance between samples in foreword motion) to the right.
    πŸŒ€ Repeat steps above to create 2nd line (two lines are required to create a scan image)
πŸ’‘For detailed information about scanning: Part 3.-Scanning


🟒 Scroll screen down to reveal the 3 blank grid screens.
🟒 Choose your mode:
    πŸŒ€ AMP Grid – Amplitude mapping (top right).
    πŸŒ€ FQ Grid – Frequency mapping (top left).
    πŸŒ€ 5D Smart Grid – AI-enhanced anomaly detection (bottom).
🟒 Select and click "choose file" (usually stored in downloads as default).
🟒 Open the selected file for analytical review (view any scan on any grid simultaneously)
πŸ’‘ For more detailed information about loading scans: Part. 4-Opening & Viewing Scan Files

🟒 View real-time 3D maps in light or dark mode.
🟒 Use the filter sliders to enhance views and help with object and feature analysis.
🟒 Use the "MODE"s to view in AMP, FQ, POINT CLOUD & to control & use the AI machine learning.
🟒 Select "AI SCAN" to automatically scan, detect and ID targets and features.
🟒 "AI SCAN" each mode to get a complete AI anomaly flag set.
🟒 Select a flag to see the AI statistics for that anomaly and right click to label the target.
🟒 Label all flagged items to train the AI - ML for future scan target recognition and identification.
πŸ’‘ For more detail about analyzing scans: Part. 5- Analyzing Scans

πŸ—ΊοΈGeo Pro 3D Full User Manual


Part 1.
Connecting a Detector

βœ… Step 1a.

Connect a Detector Using a Wireless System

Connecting your detector or scan device to your laptop if using the offline version, and to your phone or tablet if using the online version using the wireless Transmission system.
Product: UHF Wireless Audio Transmission System
🟒 Use the included or any 3.5mm aux cable to connect to the audio "output" port on your detector (may require adapter for older units) to the audio "input" port on the transmitter module.
🟒 Use the included or any 3.5mm aux cable to connect to the audio "output" port on the receiver module to the audio "input" port on the chosen device.
🟒 If your device (laptop, phone or tablet) uses:
    πŸŒ€ Separate audio TRS "in" (mic/line in) and TRS "out" (headphone/speaker) ports, use the cable in ("Step 1b") and plug it into the "mic" input port on the device.
    πŸŒ€ Combined audio TRRS "in" and "out" (headset with mic) use the adapter in ("Step 1c.") and plug an aux cable ("Step 1b") from the detector into the "mic" input port on the adapter and plug the adapter into the TRRS port on the device.
    πŸŒ€ Type-C USB input port select and use the adapter in ("Step 1d.") and connect an aux cable ("Step 1b.") from the detector and into the 3.5mm aux port on the adapter and plug the adapter type-C USB side into the device USB port. 

Mobirise Website Builder

βœ… Step 1b.

Connect a Detector "wired" to Device TRS Port

Connecting your detector or scan device to your laptop if using the offline version, and to your phone or tablet if using the online version using the wired connection.
Product: 3.5mm TRS Cable - 1/8" Male to Male
🟒 Use the included or any 3.5mm aux cable to connect to the audio "output" port on your detector (may require adapter for older units) to the audio "input" port on the device (laptop, phone, tablet).

Mobirise Website Builder

βœ… Step 1c.

Connect a Detector "wired" to Device TRRS Port

Connecting your detector or scan device to your laptop if using the offline version, and to your phone or tablet if using the online version using the wired connection.
Product: 3.5mm x 2 TRS to TRRS Splitter/ Adapter
🟒 If your device (laptop, phone or tablet) uses:
    πŸŒ€ Combined audio TRRS "in" and "out" (headset with mic) use the adapter in ("Step 1c.) and plug an aux cable ("Step 1b") from the detector into the "mic" input port on the adapter and plug the adapter into the TRRS port on the device.

Mobirise Website Builder

βœ… Step 1d.

Connect a Detector "wired" to Device Type-C Port

Connecting your detector or scan device to your laptop if using the offline version, and to your phone or tablet if using the online version using the wired connection.
Product: Type-C male to 3.5mm TRRS female
🟒  If your device (laptop, phone or tablet) uses:
    πŸŒ€ Type-C USB input port select and use the adapter in ("Step 1d.") and connect an aux cable ("Step 1b.") from the detector into a TRS to TRRS adapter ("Step 1c.") mic port and plug this into the 3.5mm aux port on the Type-C adapter ("Step 1d.") and plug the Type-C adapters male USB side into the device USB port.  

Mobirise Website Builder

Part 2.
Geo Pro 3D Online/ Offline Program Setup 

βœ… Step 2a.

Launching the Online & Offline Program

🟒 To start the online Visualizer, go to the user dashboard by logging into your online account, then select the "Visualizer Pro" button.
🟒 To start the offline Visualizer, select the Geo Pro 3D desktop icon or go to the device app section and select the icon or program name from the list.

Mobirise Website Builder

βœ… Step 2b.

Changing the Viewing Color Modes

🟒 To change the background and select between dark mode & light mode click the dark/light color change button located in the top right corner of the visualizer window. 
🟒 You can select between dark and light modes anytime as viewing conditions change and or for user preference and comfort.

Mobirise Website Builder

βœ… Step 2c.

Selecting the detector/ Scan System

🟒 To select a detector or scan system, click on the "Detector" pre-set box and select the make, then the model of the detector or scan system you intend on using. 
🟒 You can select or input optional or custom coil sizes, estimated depth capability (optional) and technology type. 
🟒 Select: "Create/Select Custom" to save or select a custom configuration of any detector or scan system.

Mobirise Website Builder

βœ… Step 2d.

Starting the Live Feed Visualizer

🟒 To start the Live Feed Visualizer click on the green "START" button.

Mobirise Website Builder

βœ… Step 2e.

Setting the Live Feed Scale Slider

🟒 To optimize the feed scale for viewing the average user frequency range, use the "FEED SCALE" Filter Slider and adjust until the main signal range is centered.

Mobirise Website Builder

βœ… Step 2f.

Setting the Gain Cut Filter Slider

🟒 To reduce master input volume (amp) and clean up the input signal, use the "GAIN CUT" Filter Slider and adjust until the feed is almost clear of background scatter.

Mobirise Website Builder

βœ… Step 2g.

Setting the Hi/Low FQ Cut Filter Slider

🟒 To reduce any extreme high or low input frequencies than can cause "peaking" (spikes in the data caused by a zero AMP/FQ reading or high or low inaudible stock interference tones.
🚨(Use with caution! Do not use unless required) 

Mobirise Website Builder

βœ… Step 2h.

Fine Tuning the Average Amp Level

🚨It is very important the idle average AMP level does not exceed the recommended range of (50) to (100)!
🟒 To fine tune, adjust the "GAIN CUT" Filter Slider ("Step 2e.").
(The total AMP range is (0) to (255) so a low to mid level is recommended to give plenty of room for AMP increase on the top end and to prevent AMP drop out on the bottom end.)

Mobirise Website Builder

βœ… Step 2i.

Locking the Control Sliders

🟒 To lock the control sliders which prevents accidental settings changes when using small screens, laptop touch screens, with gloves and on phones etc, click the red "LOCK" button. When it turns green and says "LOCKED" you settings are secure and you’re ready for the next step. (locking sliders is optional)

Mobirise Website Builder

βœ… Step 2j.

Input the File New File Name

🟒 Enter the new file name in the box.
🟒 Each time the name in this box is changed, a new scan file will be started.
🟒 Ongoing scan samples will be added to this file as long as the same name is in the file name box.
🟒 The scan can be opened after two lines are sampled and in between new saved lines.
🟒 You can continue to add more scan lines as long as this title does not change.

Mobirise Website Builder

βœ… Step 2k.

Set the Sample Pulse Rate Per Second

🚨 Setting the sample pulse rate changes how many samples are taken per second (not per distance).
🟒 Increasing the number can increase the resolution by raising the number of how many samples can be sampled in a measured distance.
🟒 Or, it can allow for faster travel speeds across a measured distance while preserving the base distance resolution.
🟒 Example (1): A (1') per second travel speed at a rate of (1) samples per second, would make a (10') grid have (10) samples per line and you would move to the right for the next line (1') distance.
🟒 Example (2): A (1') per second travel speed at a rate of (2) samples per second, would make a (10') grid have (20) samples per line and you would move to the right for the next line only (6") distance.

Mobirise Website Builder

βœ… Step 2l.

Count of Intended Sample Pulses Per Line

🟒 This setting locks in the total number of intended samples to be taken per line.  Lines do not have to have the same number of samples as other lines unless a square grid area is desired.
🟒 Using this feature along with manually changing the "y" axis slider and or the "POINT SAVE" button can be used to scan up to and around obstructions in the scan area like trees and boulders.

Mobirise Website Builder

βœ… Step 2m.

Countdown Timer until the Scan Starts

🟒 This "TIMER" feature starts a countdown at one tone per second until the scan start time at (0).
🟒 The timer can be set from 1 second to 60 seconds and gives time for the operator to get into position and begin a smooth movement as the scan starts.
🟒 During the scan procedure the system will tone at one pulse per second.
🟒 At the end of the preset sample count, a "scan end" tone sequence will sound alerting the operator that the line is done.

Mobirise Website Builder

βœ… Step 2m.

Total Points Sampled

🟒 This feature records the total sample amount recorded per scan. It provides a quick reference so the user can easily see how many samples have been achieved out of the total intended.
🟒 And example would be if the total samples will be (100) on a 10 x 10 scan, then it's easy to reference if all lines and samples have been recorded before completing the scan file.
🚨It is recommended this number be reset to (0) if a new scan file is started. (the value will increase with new scans)

Mobirise Website Builder

Part 3.
Scanning
 

βœ… Step 3a.

How to Perform a Scan

🚨 All scanning is to be performed in the same manner of direction traveled foreword (x-axis) and to the side (y-axis). Each scan line is sampled in the same foreword direction, and always move to the right to perform the next line.
🚨 Grids are formed on points sampled and not the distance traveled. So, whatever the distance is between sample points moving foreword is the distance you move to the right to start the next line.
🟒 Potential grid sizes can be any size or form from one square foot to one square mile.
🟒 Resolution depends on how many points are sampled on any given line.
🟒 Example: Small Scale Scanning- A 1'x1' square could be scanned with a one second pass at a pulse rate of 10 per sec and the resolution would be 1/10th of a foot.
🟒 Faster sample rates can provide greater resolution or provide for a faster travel speed at the same resolution.

Mobirise Website Builder

βœ… Step 3b.

Live Scan Mode

🟒 Select the Live Scan mode if a motion scan is desired.
🚨 Motion scanning must be performed at a steady consistent rate. Each line sampled should match in rate of travel and sample rate to all others in the scan.
🟒 Once all the steps in Part 2. are complete and the countdown timer is set, click the "LIVE SCAN" to start the countdown. One tone per second will sound until the start timer is at one (1). Start the motion on one (1) and cross your first sample point on zero (0). (This provides even sampling at the start position)
🟒 During the scan procedure the system will tone at one pulse per second.
🟒 At the end of the preset sample count, a "scan end" tone sequence will sound alerting the operator that the line is done.
🟒The system will automatically reset and be ready for the next line. Just hit "LIVE SCAN" again to start the next line.


Mobirise Website Builder

βœ… Step 3c.

Point Save Mode

🟒 In Point Save mode samples are taken one point at a time. This feature enables single point sampling that benefits some equipment and can provide more accurate scan results under some circumstances.
🟒 Point Save can also be used during scans where motion scan has already been applied. This way, single point can be added to a Live motion scan area.
🟒 By using a combination of Point Save and Live Scan with manual "X"-axis and or "Y"-axis settings, the user can sample around boulders and trees. Making it possible to add sample data to any point on the grid.

Mobirise Website Builder

βœ… Step 3d.

Starting a New Scan

🟒 To start a new scan, just enter a new file name. Anytime a new name is input into the box, a new file is automatically generated and waiting to accept data.
🟒 Once the name is inserted, click on the "LIVE SCAN" button to start.
🚨 Check to make sure the "SAVES" box is set to zero (0) and the "X" and "Y" sliders are in the far left, one (1) position. (This way the program is set to receive new data in the correct position format and prevent corrupt file saves)
🟒 Scan files are saved automatically line by line. It is possible to open any scan in the analyzer grids after the second line or anytime during the scanning process as new lines will be added to the file until the name is changed in the file name box..

Mobirise Website Builder

Part. 4
Opening & Viewing
Scan Files

βœ… Step 4a.

Opening Geo Pro 3D Scan Files

🟒 Scan files are stored in the "Downloads" folder by default. The user can open the files from there or move them to a folder. The "Choose File" feature will look for files in the last location used.
🟒 Click on the "Choose File" box, Select the most recent file or select by name and click on open.

Mobirise Website Builder

βœ… Step 4b.

Viewing Geo Pro 3D Scan Files

🟒 Open scan files in any of the three (3) grids. (Amplitude - top left, Frequency - top right and the 5D Smart Grid - bottom)
🟒 Three (3) of the same or three (3) different scan files can be loaded and viewed simultaneously.
🟒 Amplitude Grid: Shows the Amplitude value in both color and form.
🟒 Frequency Grid: Shows the Frequency value in both color and form.
🟒 5D Smart Grid: Shows the relationships between frequency, amplitude, harmonics and Nano-timing. And uses these with AI deep learning to show several forms of information at once.
    πŸŒ€ Colors for material, density and mag.
    πŸŒ€ Peaked map for value and form
    πŸŒ€ 2-D flat plane for standard values
    πŸŒ€ 2-D line drawings at the bottom for AI recognized forms like linear features, boxes, dissimilar metals and materials etc.

Mobirise Website Builder

Part. 5
Analyzing Scans

βœ… Step 5a.

AMP (amplitude) and FQ (frequency) Grids.

🟒 The top two grids on the analyzer grid section map values of both AMP and FQ. These can used for quick reference to check that good data was pulled in both spectrums.
🟒 Each as well can identify separate anomalies before a deeper look can be made.

Mobirise Website Builder

βœ… Step 5b.

5D AI Smart Grid

🟒 5D Smart Grid: The AI (artificial Intelligence) uses machine learning to show the relationships between frequency, amplitude, harmonics and Nano-timing. And uses these with AI deep learning to show several forms of information at once.
🟒 On top we see the AI generated topographic map of the object "values" in the scan with the material relationships featured with color.
🟒 The middle layer shown is a 2-D flat plane across and showing the field (mag, VLF, etc) and the standard relationships of "hot" zones and "shield" or "cold" zones.
🟒 The bottom layer is drawn by the AI to help it show the user things it has discovered in the field. It focuses on finding and outlining features, objects and geometric anomalies. Different materials are shown here in different tones of color or different colors entirely.

Mobirise Website Builder

βœ… Step 5c.

soon

soon

Mobirise Website Builder

βœ… Step 5d.

soon

soon

Mobirise Website Builder

βœ… Step 5e.

soon

soon

Mobirise Website Builder

βœ… Step 5f.

soon

soon

Mobirise Website Builder

βœ… Step 5g.

soon

soon

Mobirise Website Builder

βœ… Step 5h.

soon

soon

Mobirise Website Builder

βœ… Step 5i.

soon

soon

Mobirise Website Builder